
golang 自身提供的工具中包括性能分析工具 - pprof。这个工具被实现在两个位置:
- runtime/pprof:采集器,负责采集应用程序的运行数据供给 pprof 可视化工具
- net/http/pprof:通过一个 HTTP Server 将 prof 数据进行可视化分析。
golang 内建提供了多种性能收集器,它们负责收集这些性能数据:
- Goroutine: stack traces of all current Goroutines。Go Routine 分析。
- CPU: stack traces of CPU returned by runtime。CPU 分析。
- Heap: a sampling of memory allocations of live objects。内存分析,堆分配情况以及内存泄漏等。
- Allocation: a sampling of all past memory allocations。内存分析,对象分配统计以及内存泄漏等。
- Thread: stack traces that led to the creation of new OS threads。OS 线程创建情况。
- Block: stack traces that led to blocking on synchronization primitives。阻塞分析。记录 go routine 阻塞情况,等待以及同步情况,timer/channel 通讯等各项细节。
- Mutex: stack traces of holders of contended mutexes。互斥锁分析。包括各种竞争情况。
在 app 中收集性能数据
当我们需要针对一个 app 进行性能分析时,首先的问题是如何收集性能数据。在 golang 中,上面提到的性能数据可以通过几种方式来收集:
go test 方式
go test 方式可以无侵入地从你的 app 中收集性能数据,你可以使用这样的命令行:
1

go test -cpuprofile cpu.prof -memprofile mem.prof -bench .
由于我们被约定通过 benchmark 测试方式来测试 app 的运行性能,所以上面的命令行是发起 benchmark 测试的。但是你也可以采用 coverage 测试方式来做:
1
2

go test . -v -race -coverprofile=coverage.txt -covermode=atomic -timeout=20m -test.short -cpuprofile cpu.prof -memprofile mem.prof | tee coverage.log
go tool cover -html=coverage.txt -o cover.html
无论采用哪一种 go testing 手段,你都可以加入命令行参数来收集性能数据。
可用的命令行选项有:
- -memprofile mem.prof
- -memprofilerate 4096
- -cpuprofile cpu.prof
- -blockprofile block.prof
- -blockprofilerate 4096
- -mutexprofile mutex.prof
- -mutexprofilefraction 1
- -trace trace.out
也可以查阅源码:src/testing/testing.go - The Go Programming Language
web 应用类
对于 Webapp 应用类,或者系统服务类等持续性工作的 app,我们可以做实时的性能数据分析,也即 live profile download 或者 live profiling。
最简单的方法是嵌入 “net/http/pprof” 包,当你使用标准的 DefaultServeMux 方式来启动 http 服务时,什么都不必做:
1
2
3
4
5
6
7
8
9
10

package main

import (
	"net/http"
	_ "net/http/pprof"
)

func main() {
	http.ListenAndServe(":8080", nil)
}
“net/http/pprof” 包将会自动地添加一组 api 端点,该包的 init 函数会做这些事:
1
2
3
4
5
6
7

func init() {
	http.HandleFunc("/debug/pprof/", Index)
	http.HandleFunc("/debug/pprof/cmdline", Cmdline)
	http.HandleFunc("/debug/pprof/profile", Profile)
	http.HandleFunc("/debug/pprof/symbol", Symbol)
	http.HandleFunc("/debug/pprof/trace", Trace)
}
所以你的 HTTP 服务器自动拥有上面这些端点。那么接下来你可以通过浏览器直接访问上述端点,也可以让 pprof 使用这些端点来进行交互式分析:
1
2
3
4

go tool pprof http://localhost:8080/debug/pprof/heap
> top
...
> exit
关于进一步的说明要在后续章节中详细剖析,详见 []。
如果你没有采用默认的 DefaultServeMux 方式,那就需要手动地链接端点到你的 mux。例如对于 gin 来说,可能会是这样:
1
2
3
4
5
6
7
8
9
10
11
12
13
14

r := gin.Default()
r.GET("/debug/pprof/allocs", WrapH(pprof.Handler("allocs")))
r.GET("/debug/pprof/block", WrapH(pprof.Handler("block")))
r.GET("/debug/pprof/goroutine", WrapH(pprof.Handler("goroutine")))
r.GET("/debug/pprof/heap", WrapH(pprof.Handler("heap")))
r.GET("/debug/pprof/mutex", WrapH(pprof.Handler("mutex")))
r.GET("/debug/pprof/threadcreate", WrapH(pprof.Handler("threadcreate")))
r.Run(":8080")

func WrapH(h http.Handler) gin.HandlerFunc {
	return func(c *gin.Context) {
		h.ServeHTTP(c.Writer, c.Request)
	}
}
一般应用程序
如果你的 app 并非持续性 web 服务,那么也可以通过 runtime/pprof 包来手工插入 prof 专用代码到应用程序中,然后在运行结束后拿着产生的 cpu.prof 或 mem.prof 等数据收集文件到 pprof 中进行分析。
借助于 pkg/profile
这里有一个简单的应用程序:
1
2
3
4
5
6
7
8
9
10
11
12
13
14
15
16
17
18

package main

import (
	"fmt"
	"github.com/pkg/profile"
)

func main(){
	defer profile.Start(profile.ProfilePath(".")).Stop()
	a()
}

func a(){
	for i:=0;i<10000; i++{
		fmt.Print(".")
	}
	fmt.Println()
}
它简单地收集 cpu 数据产生 cpu.prof 文件,你可以直接分析该文件:
1

go tool pprof -http=:6060 cpu.prof
你还可以收集其他数据,这需要在 main 函数的开头加入这些调用:
1
2
3
4
5
6
7
8
9
10
11
12
13
14
15
16
17
18
19

// CPUProfile enables cpu profiling. Note: Default is CPU
defer profile.Start(profile.CPUProfile).Stop()

// GoroutineProfile enables goroutine profiling.
// It returns all Goroutines alive when defer occurs.
defer profile.Start(profile.GoroutineProfile).Stop()

// BlockProfile enables block (contention) profiling.
defer profile.Start(profile.BlockProfile).Stop()

// ThreadcreationProfile enables thread creation profiling.
defer profile.Start(profile.ThreadcreationProfile).Stop()

// MemProfile changes which type of memory profiling to
// profile the heap.
defer profile.Start(profile.MemProfile).Stop()

// MutexProfile enables mutex profiling.
defer profile.Start(profile.MutexProfile).Stop()
2022-07-28:
经 @vimiix 提示,以下表述不正确,pkg/profile 是单调的,不能一次性叠加,需要多次调用。
但一次只能加入一种性能数据的调用。如果你想要同时添加多种,需要这样做调用:
此方法可以继续延展,因为 Start(…) 采用了 Options Pattern。
不过,如果你想要更多定制特性时,或许不得不通过 runtime/pprof 自行编码以便支持个性化选项。
自行编码
这里有一个简单的 demo 程序,向你展示了怎么进行定制性编码来收集性能数据,你可以在此基础上进一步地改善它:
1
2
3
4
5
6
7
8
9
10
11
12
13
14
15
16
17
18
19
20
21
22
23
24
25
26
27
28
29
30
31
32
33
34
35
36
37
38
39
40
41
42
43
44
45
46
47
48
49
50
51
52
53
54
55
56
57
58
59
60
61
62
63
64
65
66
67
68
69
70
71
72
73
74
75
76
77
78
79
80
81
82
83
84
85
86
87
88
89
90
91
92
93
94

package main

import (
	"fmt"
	"github.com/hedzr/log"
	stdLog "log"
	"os"
	"runtime"
	"runtime/pprof"
	"sync"
)

func main() {

	if cpuProfile != "" {
		defer enableCpuProfile(cpuProfile)()
	}
	if memProfile != "" {
		defer enableMemProfile(memProfile)()
	}

	var wg sync.WaitGroup
	wg.Add(1)
	go a(&wg)
	wg.Add(1)
	go b(&wg)
	wg.Wait()
}

func a(wg *sync.WaitGroup) {
	for i := 0; i < 10000; i++ {
		fmt.Print(".")
	}
	fmt.Println()
	wg.Done()
}

func b(wg *sync.WaitGroup) {
	for i := 0; i < 10000; i++ {
		fmt.Print("_")
	}
	fmt.Println()
	wg.Done()
}

var cpuProfile, memProfile string

func init() {
	stdLog.SetFlags(stdLog.LstdFlags | stdLog.Llongfile)
	cpuProfile, memProfile = "cpu.prof", "mem.prof"
}

//
// And review the pprof result in a web ui:
//
//    go tool pprof -http=:8555 ./cpu.pprof
//
// Now you can open 'http://localhost:8555/ui' in a browser
//
func enableCpuProfile(cpuProfilePath string) (closer func()) {
	closer = func() {}
	if cpuProfilePath != "" {
		f, err := os.Create(cpuProfilePath)
		if err != nil {
			log.Fatal("could not create cpu profile: %v", err)
		}
		err = pprof.StartCPUProfile(f)
		if err != nil {
			log.Fatal("error: %v", err)
		}
		closer = pprof.StopCPUProfile
	}
	runtime.SetBlockProfileRate(20)
	return
}

func enableMemProfile(memProfilePath string) (closer func()) {
	closer = func() {}
	if memProfilePath != "" {
		closer = func() {
			f, err := os.Create(memProfilePath)
			if err != nil {
				log.Fatal("could not create memory profile: ", err)
			}
			defer f.Close()
			runtime.GC() // get up-to-date statistics
			if err := pprof.WriteHeapProfile(f); err != nil {
				log.Fatal("could not write memory profile: ", err)
			}
		}
	}
	return
}
以上
cmdr 集成
在 hedzr/cmdr (v1.7.46+) 中,我们提供了完整的附加包 pprof 来简化一般应用程序集成 go tool pprof 的简便方案。如果你正在利用 cmdr 进行命令行应用程序的开发,那么简单地:
1
2
3
4
5
6
7
8
9
10
11
12
13
14
15
16
17
18
19
20
21
22
23
24
25
26
27
28
29
30
31
32
33
34
35
36

package main

import (
	"github.com/hedzr/cmdr"
	"github.com/hedzr/cmdr/plugin/pprof"
	"github.com/hedzr/log"
	"github.com/hedzr/logex/build"
	"gopkg.in/hedzr/errors.v2"
)

func main() { Entry() }

func Entry() {
	if err := cmdr.Exec(buildRootCmd(),
		cmdr.WithLogx(build.New(build.NewLoggerConfigWith(true, "logrus", "debug"))),
		pprof.GetCmdrProfilingOptions(),
	); err != nil {
		log.Fatalf("error occurs in app running: %+v\n", err)
	}
}

func buildRootCmd() (rootCmd *cmdr.RootCommand) {
	root := cmdr.Root(appName, cmdr.Version).
		Copyright(copyright, "hedzr").
		Description(desc, longDesc).
		Examples(examples)
	rootCmd = root.RootCommand()

	cmdr.NewBool(false).
		Titles("enable-ueh", "ueh").
		Description("Enables the unhandled exception handler?").
		AttachTo(root)

	//pprof.AttachToCmdr(root.RootCmdOpt())
	return
}
你可以如 Line 17 那样简单地集成 pprof 附加包,也可以像 Line 35 那样将其明确地附着在 root 上。它会为你提供一组命令行参数,如 -ep 等等:
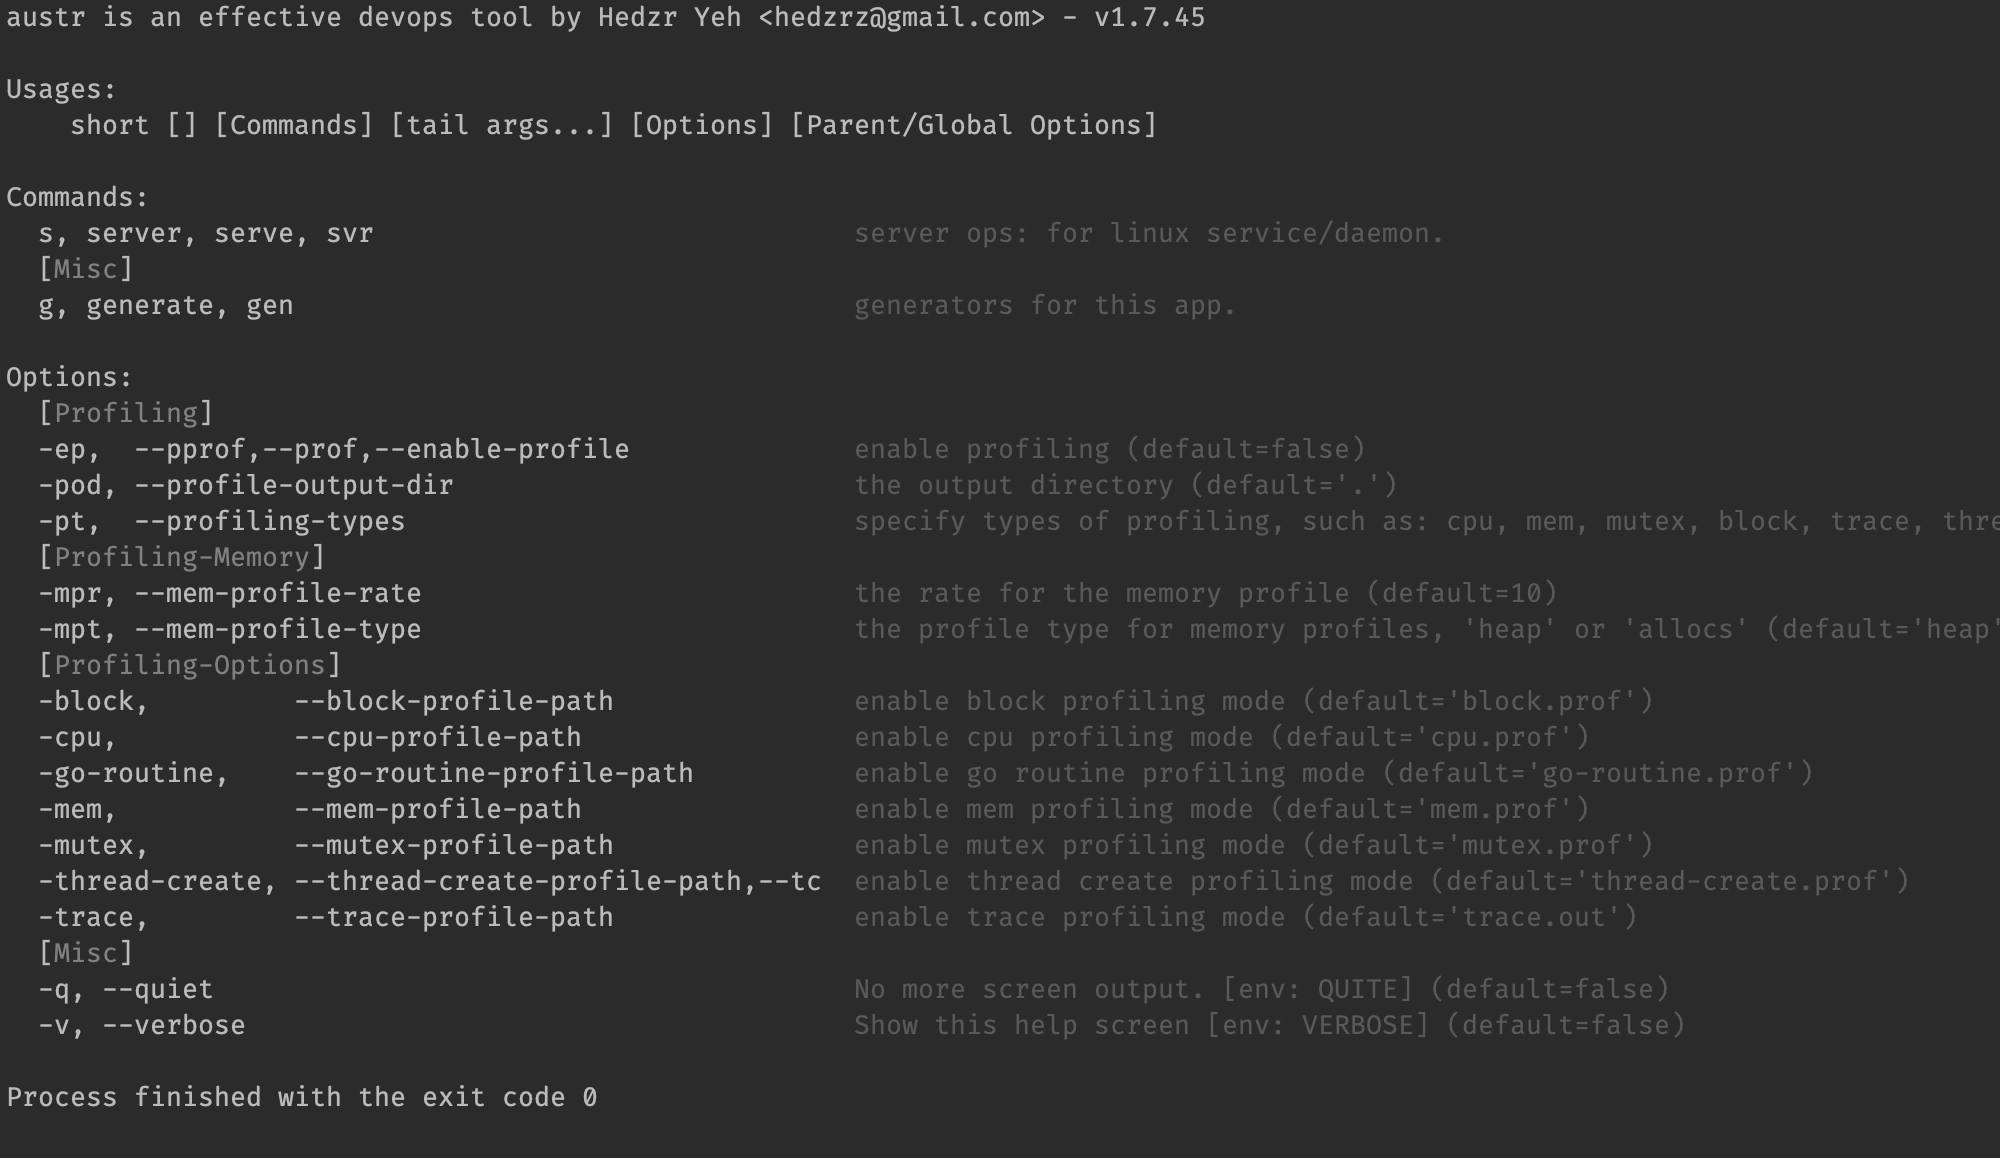
对于这样的应用程序,可以简单地启用 profiling 和 pprof:
1
2
3

app -ep
app --pprof
app --enable-profile
默认情况下,它会产生 cpu.prof, mem.prof 等几个性能数据文件。如果你认为有必要改变要收集的性能数据类别,可以这样调用:
1
2
3

pprof.GetCmdrProfilingOptions("cpu", "mem", "mutex", "block", "thread-create", "trace", "go-routine"),
// Or
pprof.AttachToCmdr(root.RootCmdOpt(), "cpu", "mem", "mutex", "block", "thread-create", "trace", "go-routine")
我们当然会强烈推荐你采用 cmdr 来简化 profiling 集成工作,而且不仅仅是对此的简化,也包含更多的 CLI 辅助特性。
可视化工具 pprof
一般来说我们有两种方式来启动 pprof 可视化工具:直接运行,或者编写一小段代码来启动。
无论你通过哪种方式获得了 prof 数据,你都可以简单地以其为待分析数据直接启动可视化工具:
1

go tool pprof -http=:6060 cpu.prof
使用 pprof 命令行工具
pprof 有独立的命令行工具,你可以这样安装它:
1

go get -u github.com/google/pprof
这条命令会拉取 pprof 的源代码编译为命令行执行文件 pprof 并放在 $GOPATH/bin 中,它需要你有完整的 golang 编译环境(这当然不必赘述了)。
尽管如此,这个独立的命令行工具其实和 go tool pprof 是没有任何区别的。所以假设我们有获得 prof 数据,那么以下方式都可以启动可视化工具:
1
2

pprof -http=:6060 cpu.prof
go tool pprof -http=:6060 cpu.prof
生成报告
在 pprof 交互模式中,可以使用 pdf 命令生成报告。
通过 TTY 交互终端
如果没有指定 -web 或者 -http 参数,则 pprof 会进入交互模式。
查看实时数据
如果你的 app 是 http 服务类型的,并且嵌入了 “net/http/pprof” 包,那么一系列端点(/debug/pprof/*)就是可用的,此时可以直接从对应端点下载性能数据并在交互模式中供你分析:
1
2

go tool pprof 'http://localhost:6060/debug/pprof/profile?seconds=30'
(pprof) top
但实际上你往往可以直接在浏览器中打开这些端点以便直接观察性能数据的快照。
在交互模式中,这些命令很常用:
q/exit/quit
退出交互模式,返回 Shell 命令行界面。
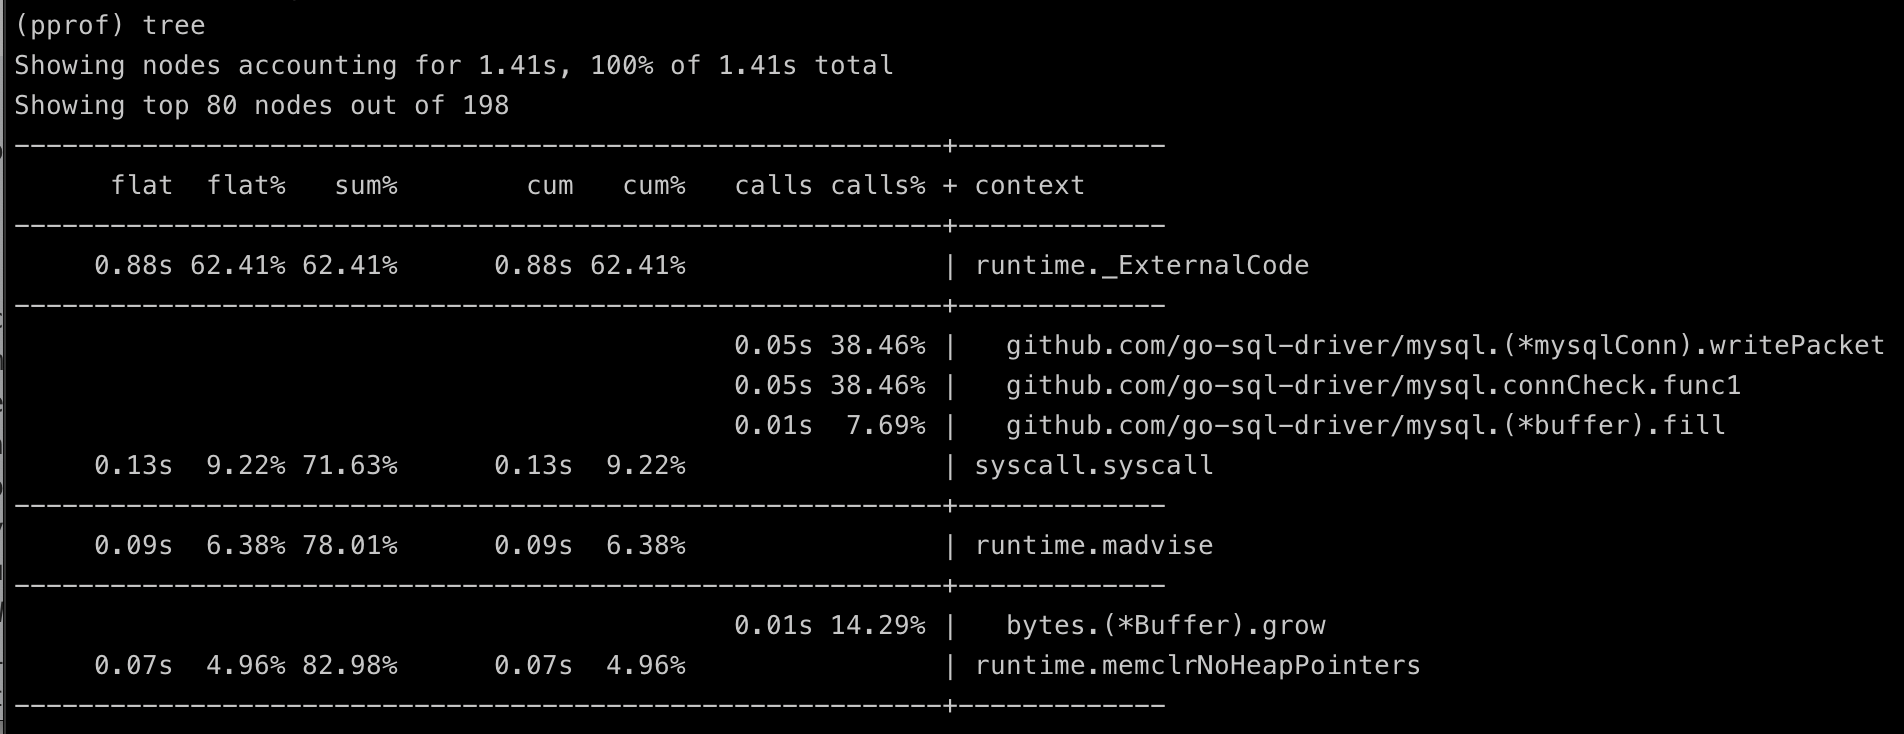
tree
显示调用结构的文字版本。
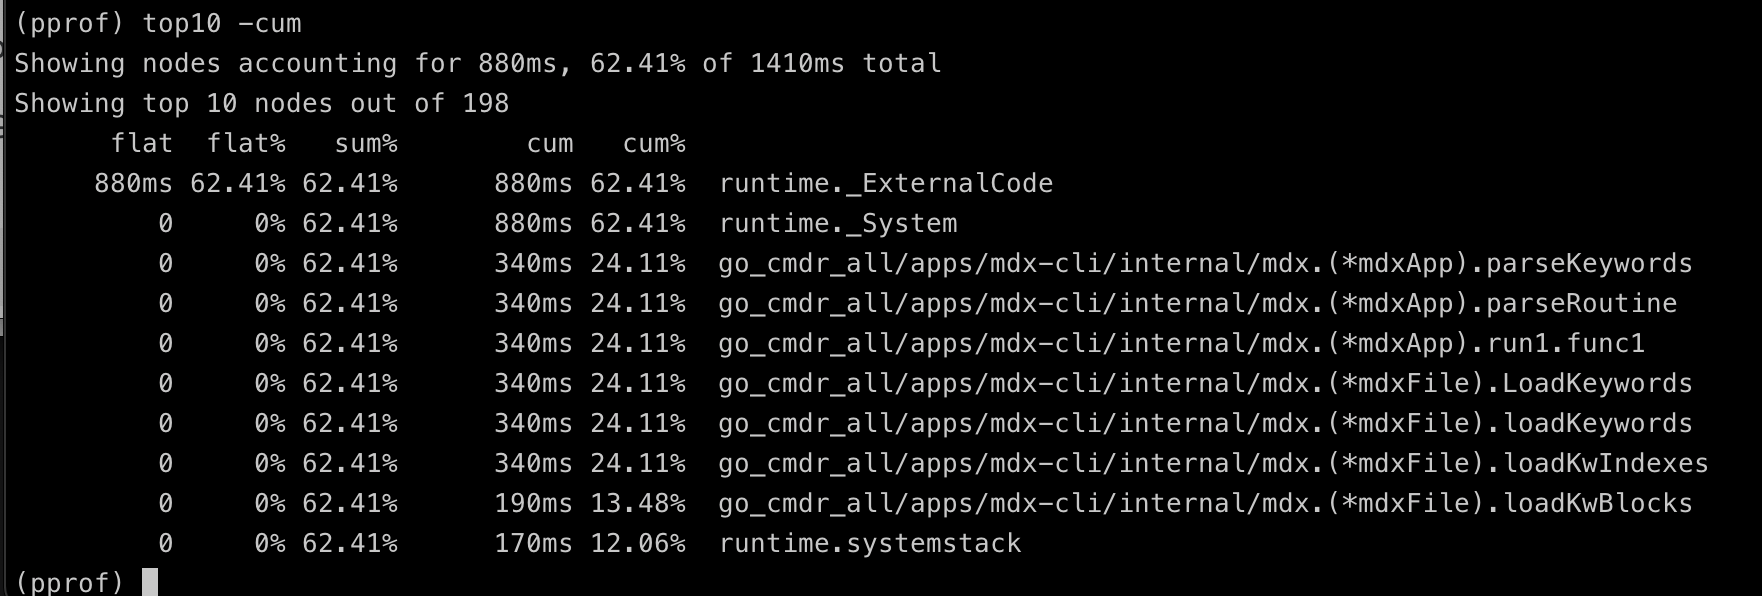
top
显示耗时前几名。可以加上数字,例如 top5, top10,还可以附加参数 -cum 按照 cumulative 累积时间排序,这个参数常常很有用地帮助你展示出调用序列。
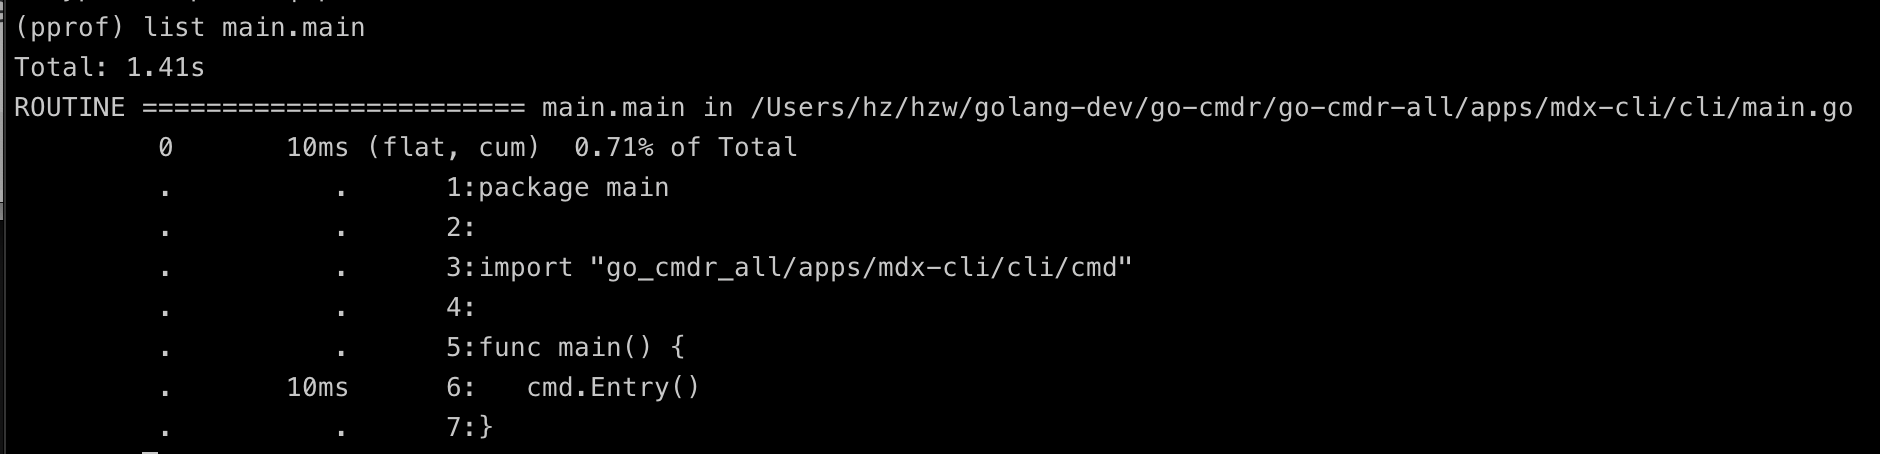
list
List 命令显示指定的包中指定的函数的性能数据。
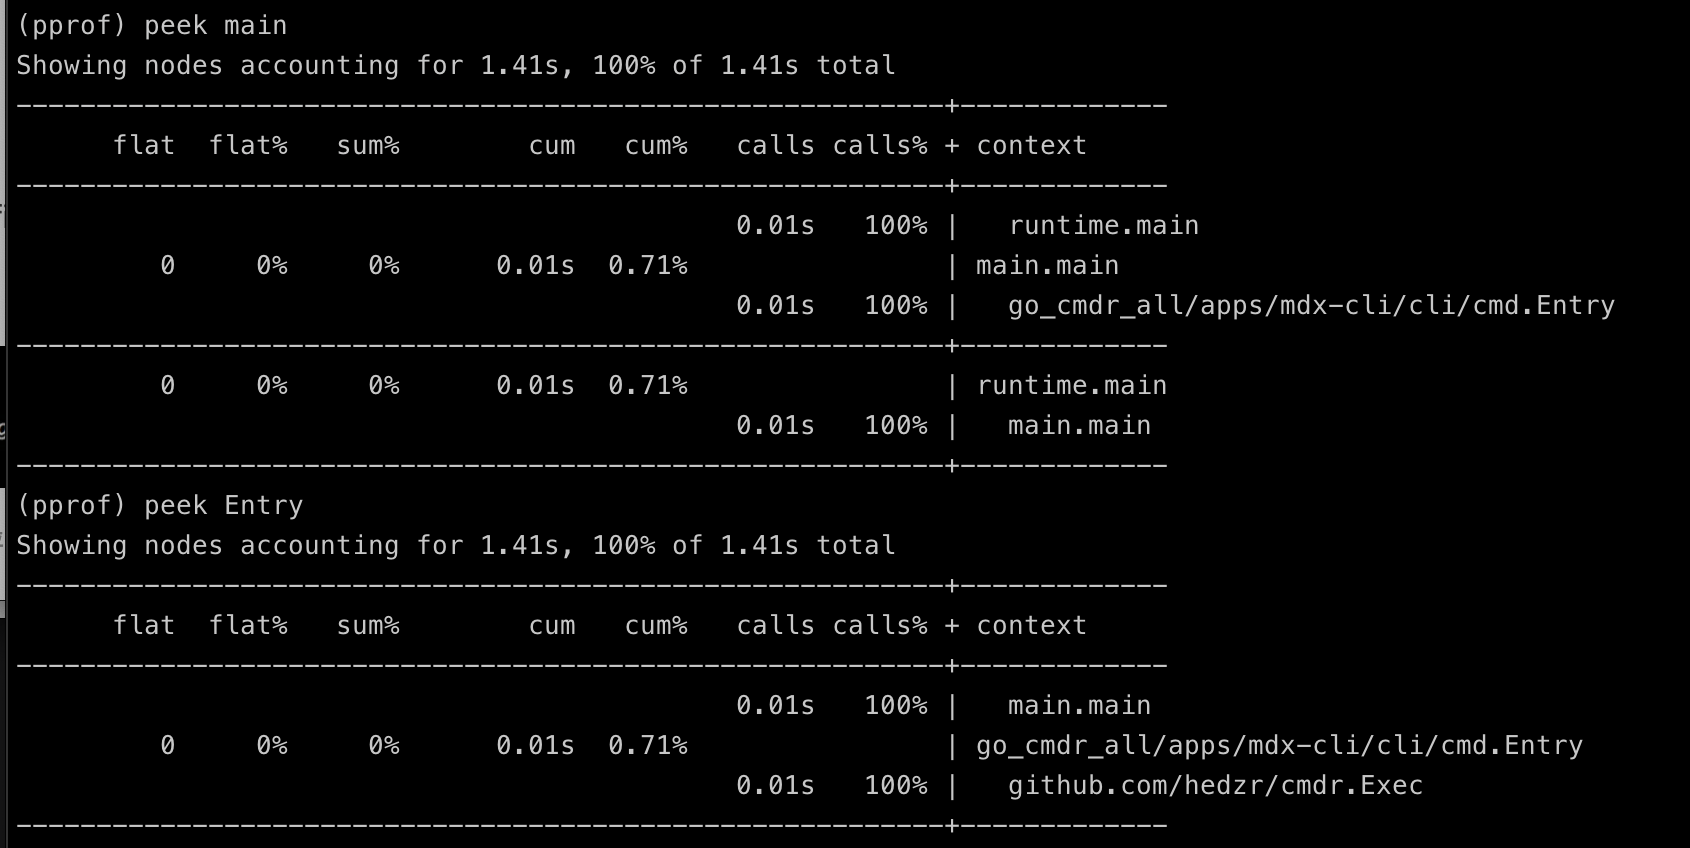
peek
peek 命令和 list 相似,但你可以在这里指定一个模糊的关键字,例如:
通过浏览器查看
当使用浏览器方式查阅 cpu 性能数据时,我们可以通过 pprof 的 web 界面查看多种视图。
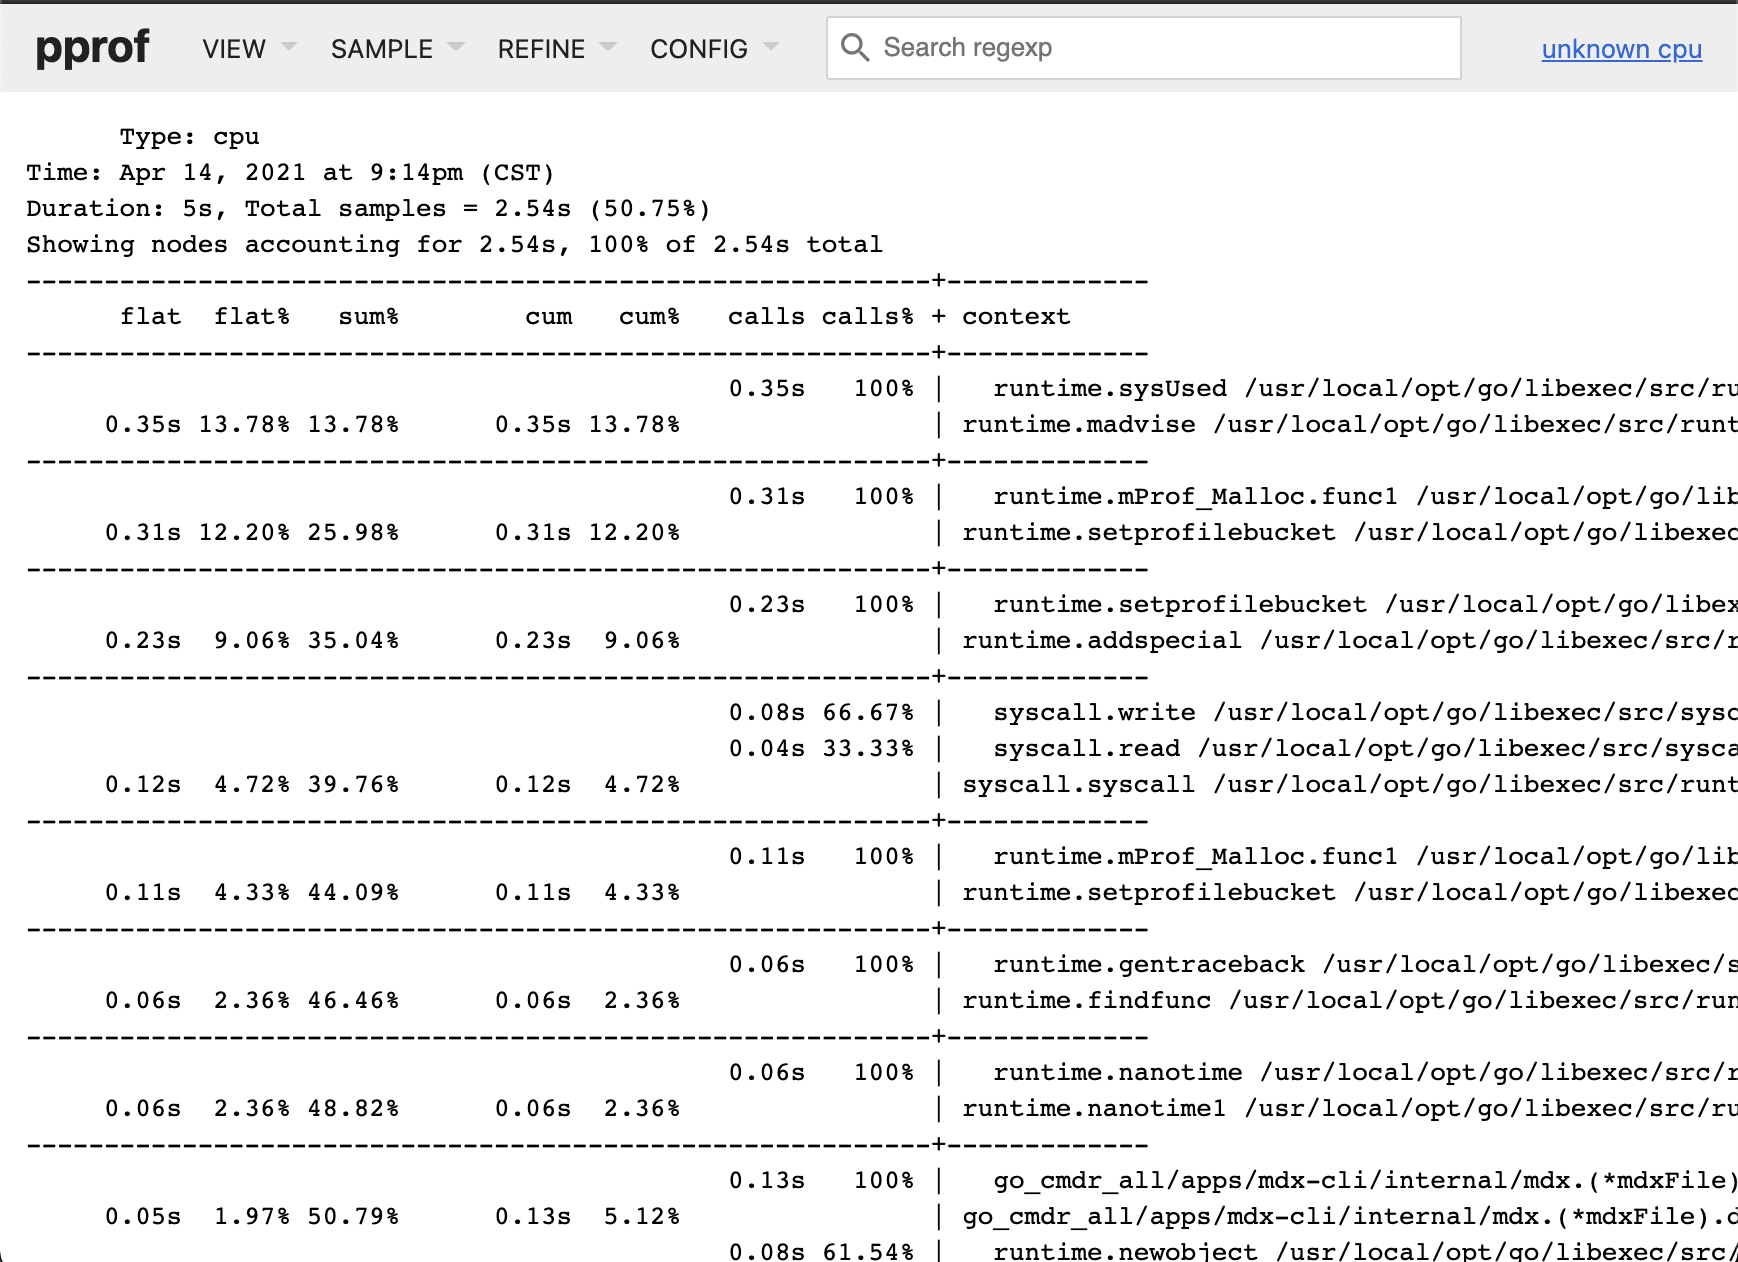
top view
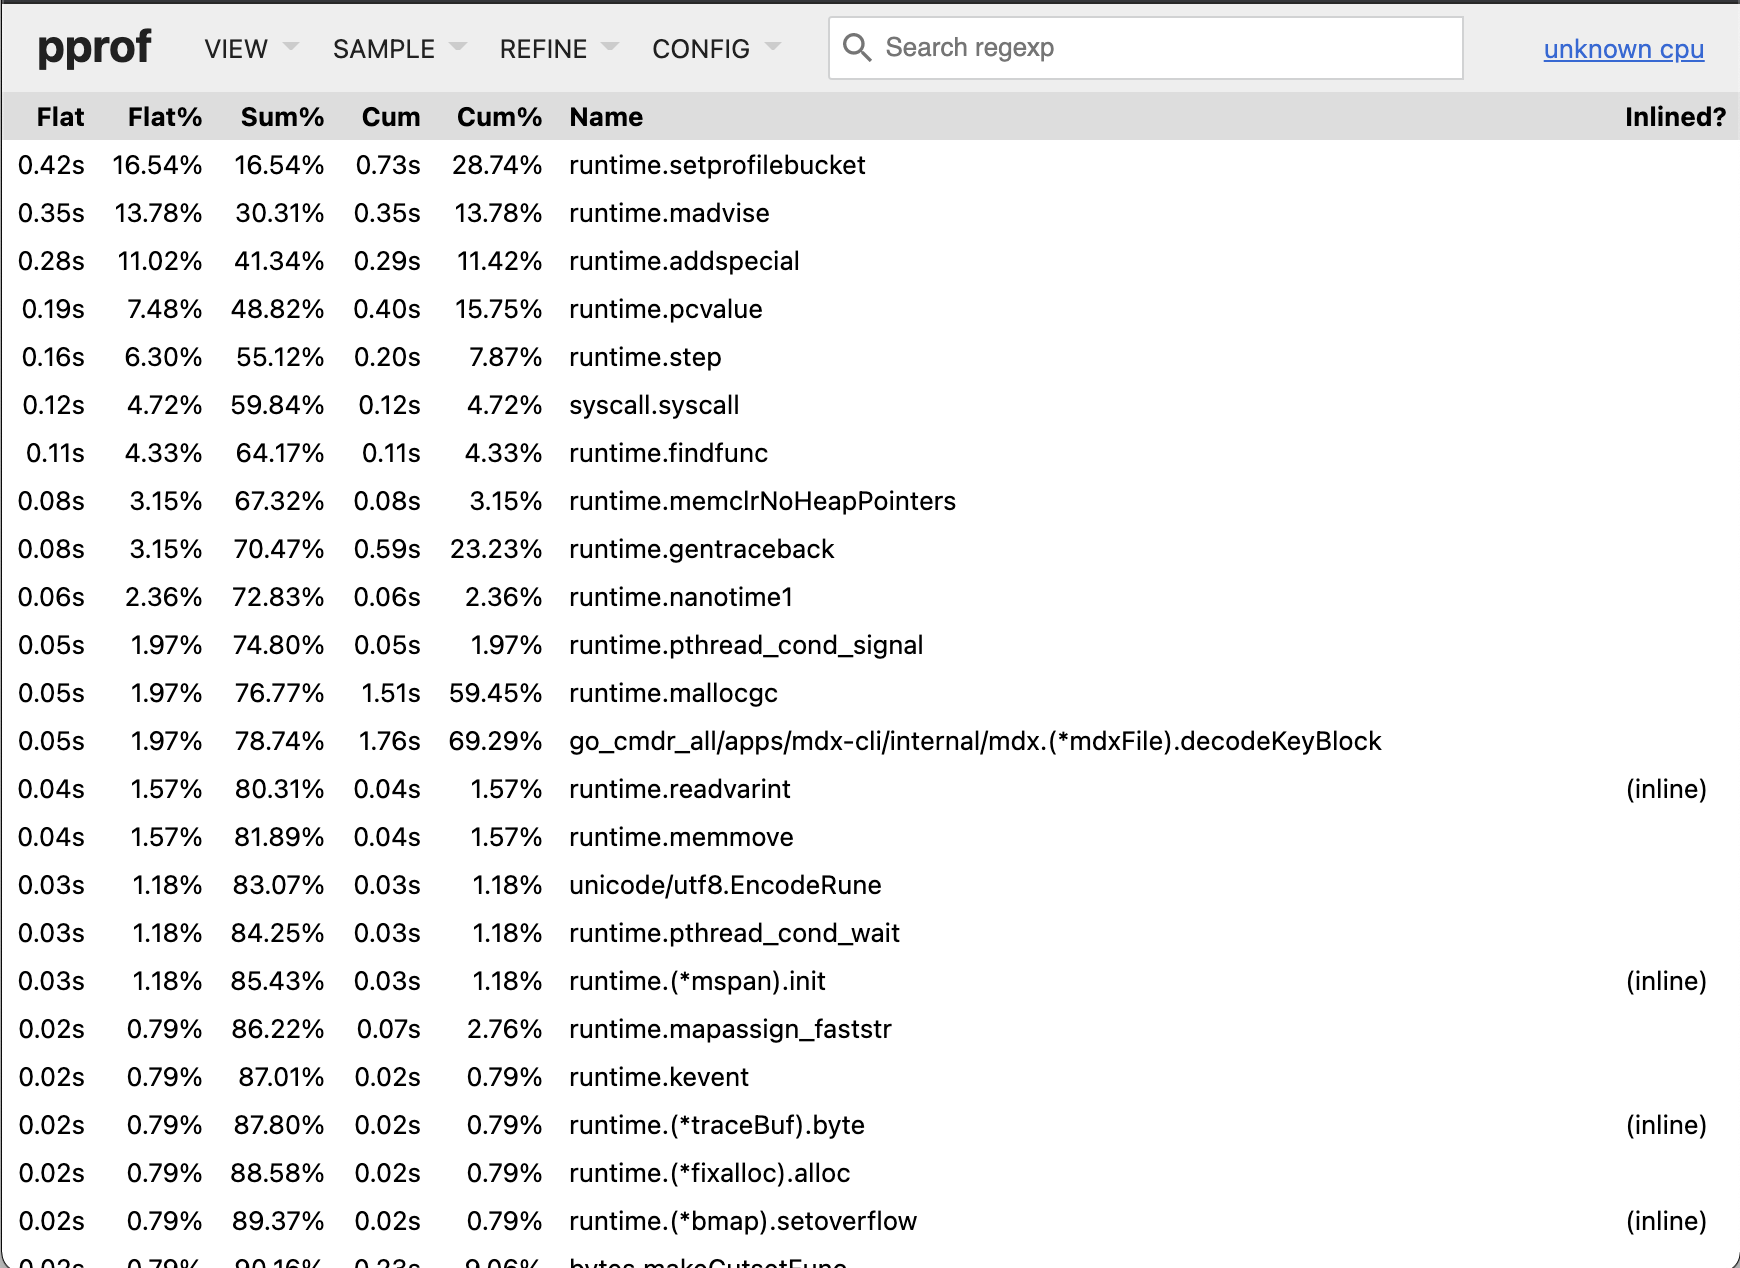
此视图较为简单,但由于 go 核心调用以及系统调用的比重较大,所以你需要耐心排除它们,然后才能找到业务逻辑的 topN。
如果你想要更好的检索 topN,可以通过交互方式直接执行 top10 -cum,top5 -cum 命令,或者在web 视图中点击表头 cum 重新排序,此时业务代码通常会被优先排列。
Grpah 视图
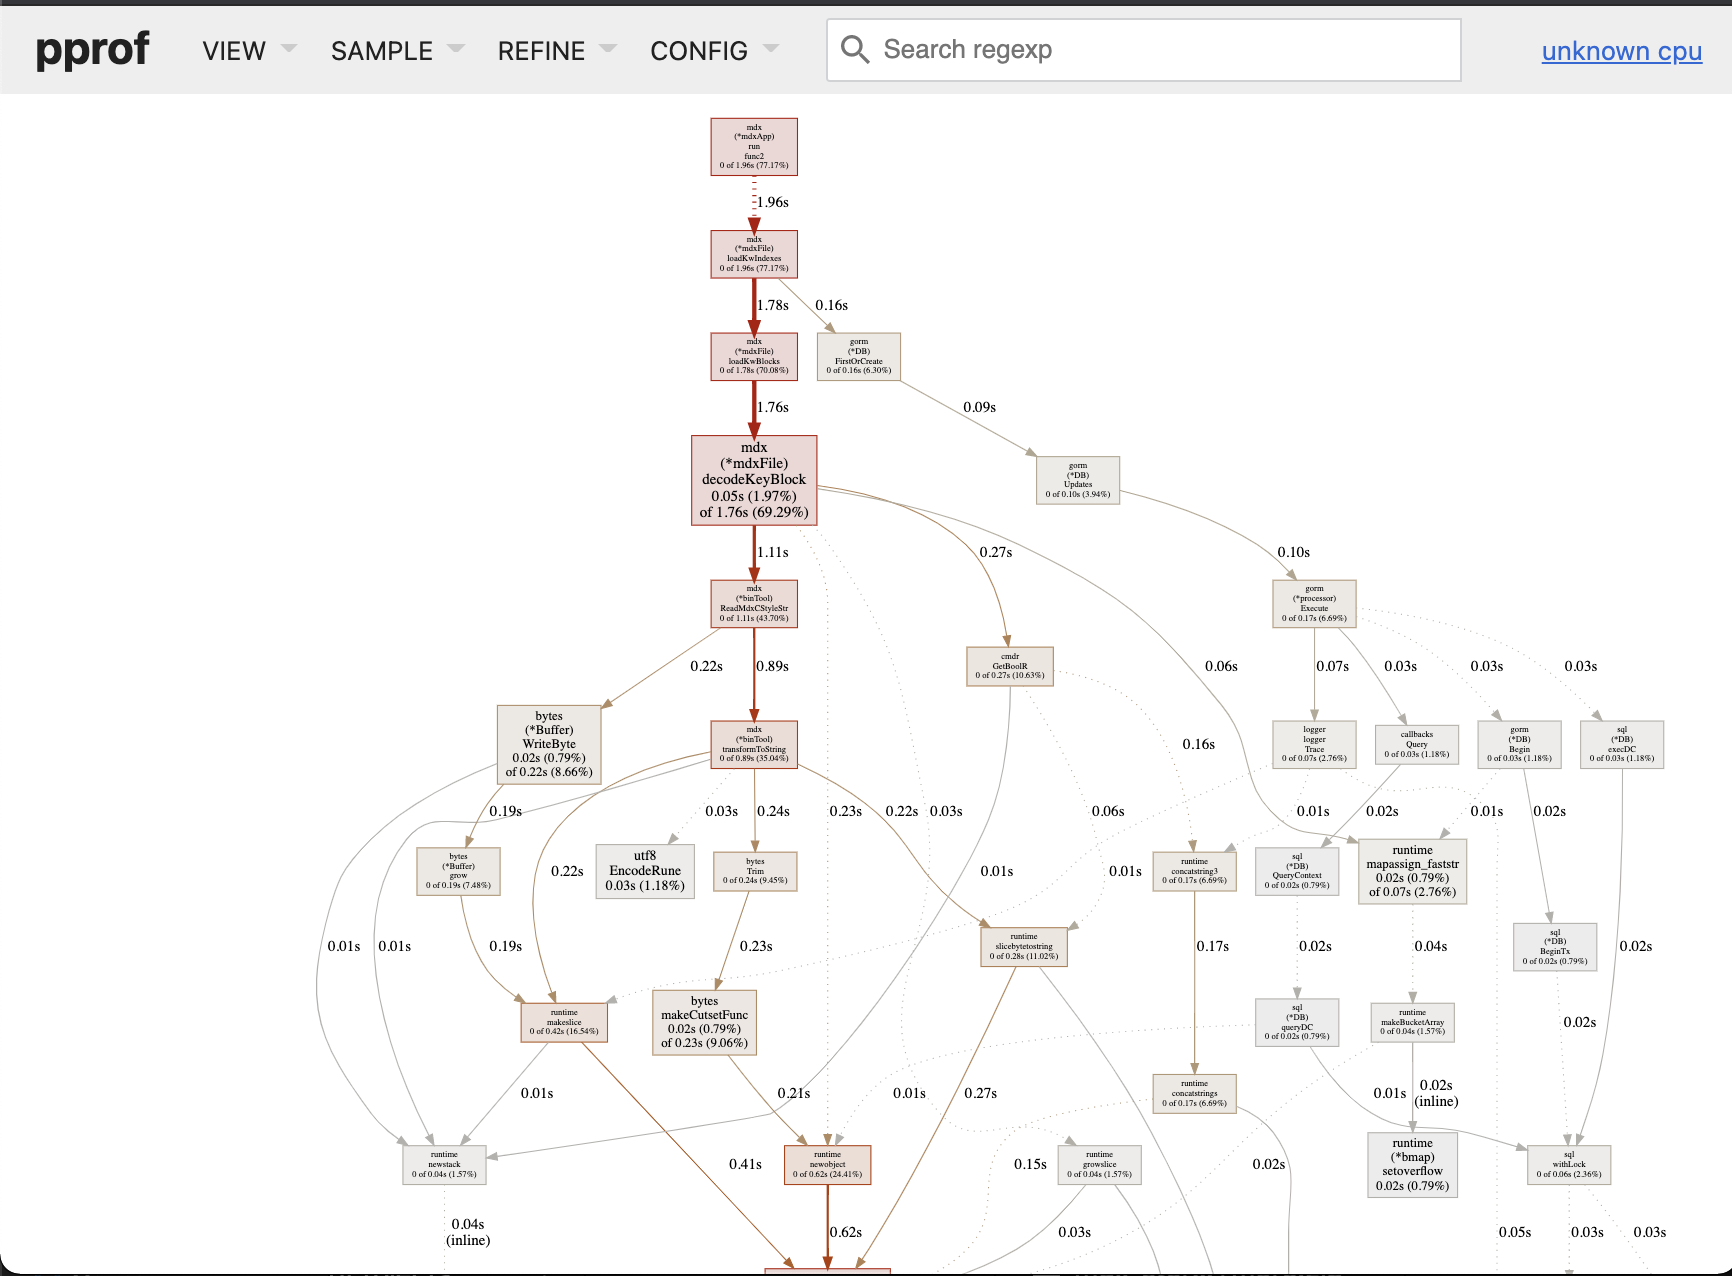
Grpah 视图是按照 app 执行顺序排列的,几乎等价于流程图。此视图中字体越大代表着耗时越多。
Flame Graph 视图
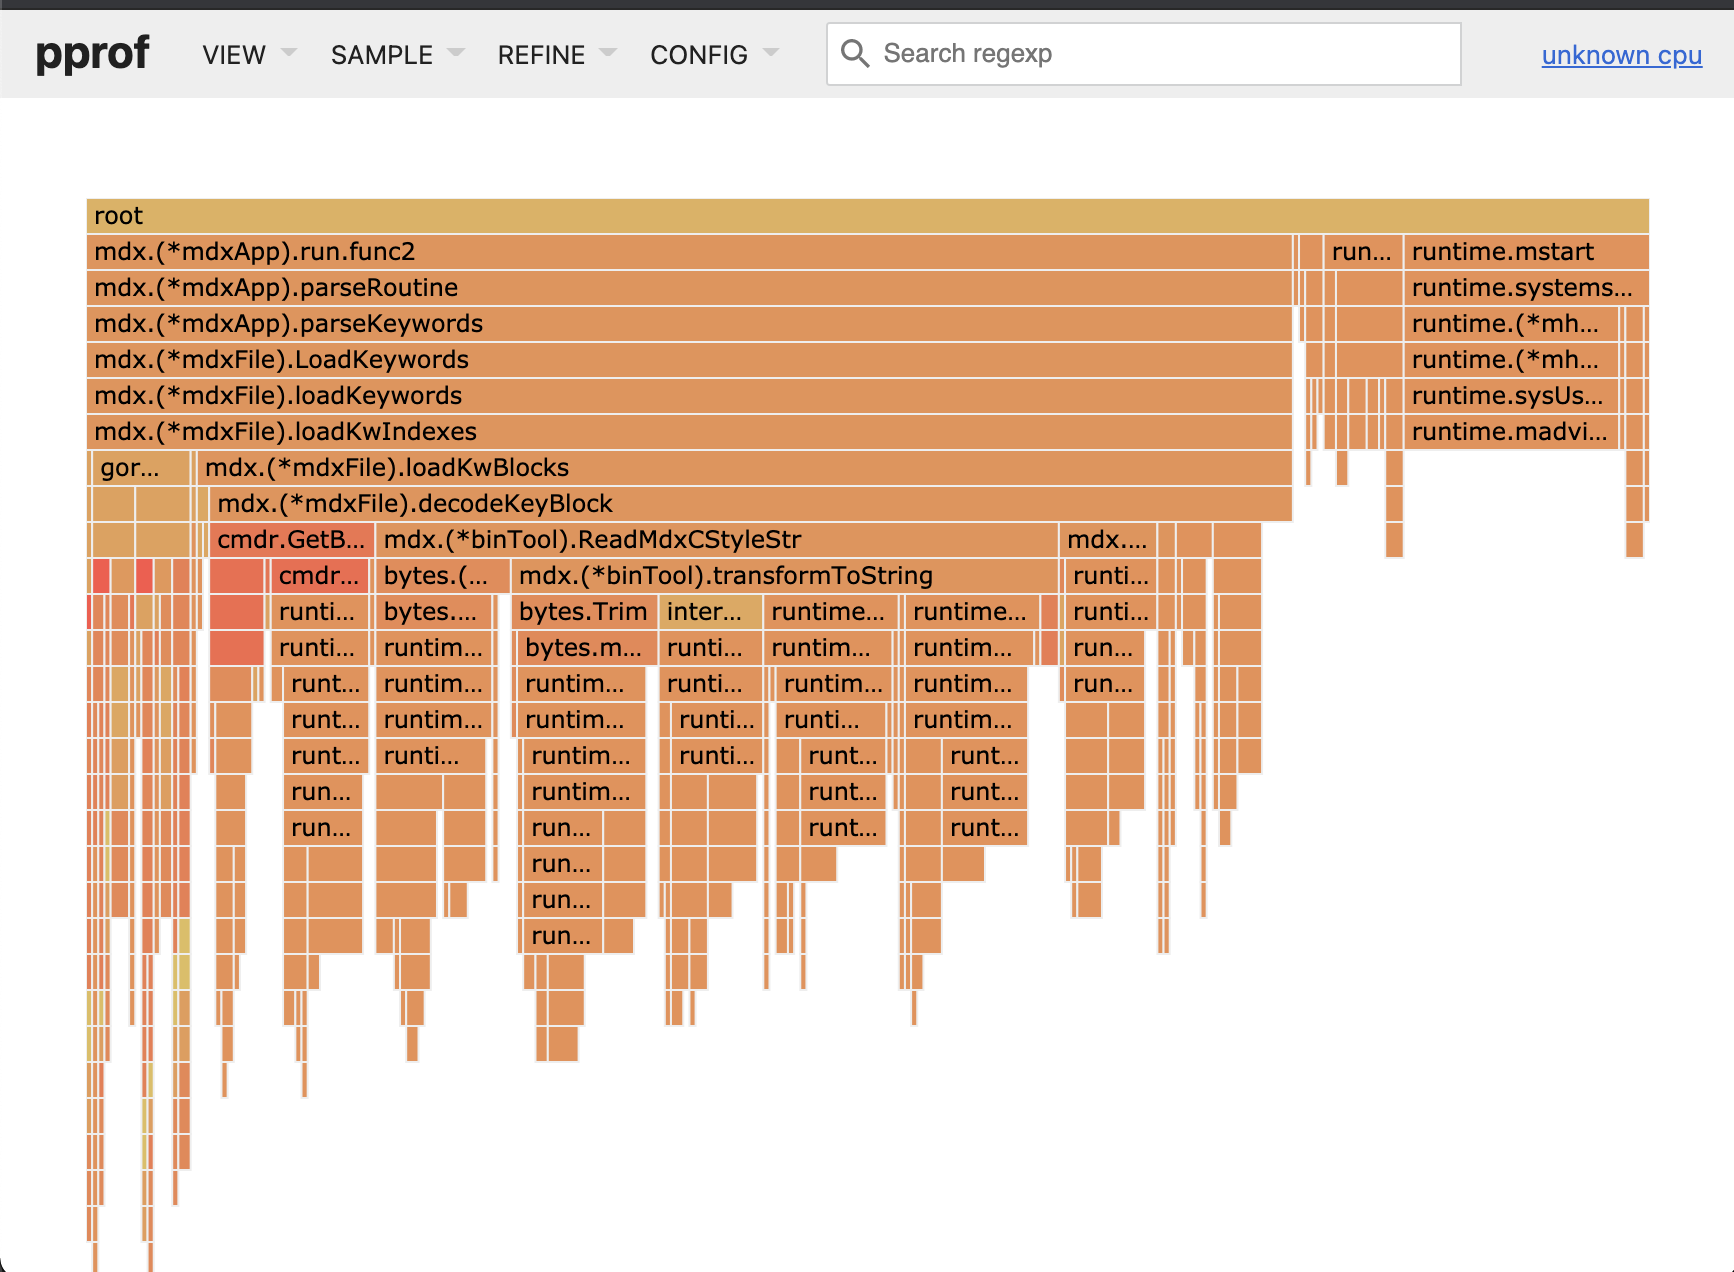
火焰图也是按照执行顺序从上向下排列的,其中一个函数的宽度占比代表了其耗时比例,越宽则耗时越多,所以简单看的话能看清函数签名的就是耗时多的。但是由于程序结构(例如goroutine,timerproc 等)的多样性,这样的简单判断并不确切。在大型程序中你需要仔细地排除杂音,正确地 REFINE 之后才能得到有价值的性能判定。
Peek 视图
Peek 视图以文字表格的形式列出耗时统计表,你可以对其做筛选。
Source View
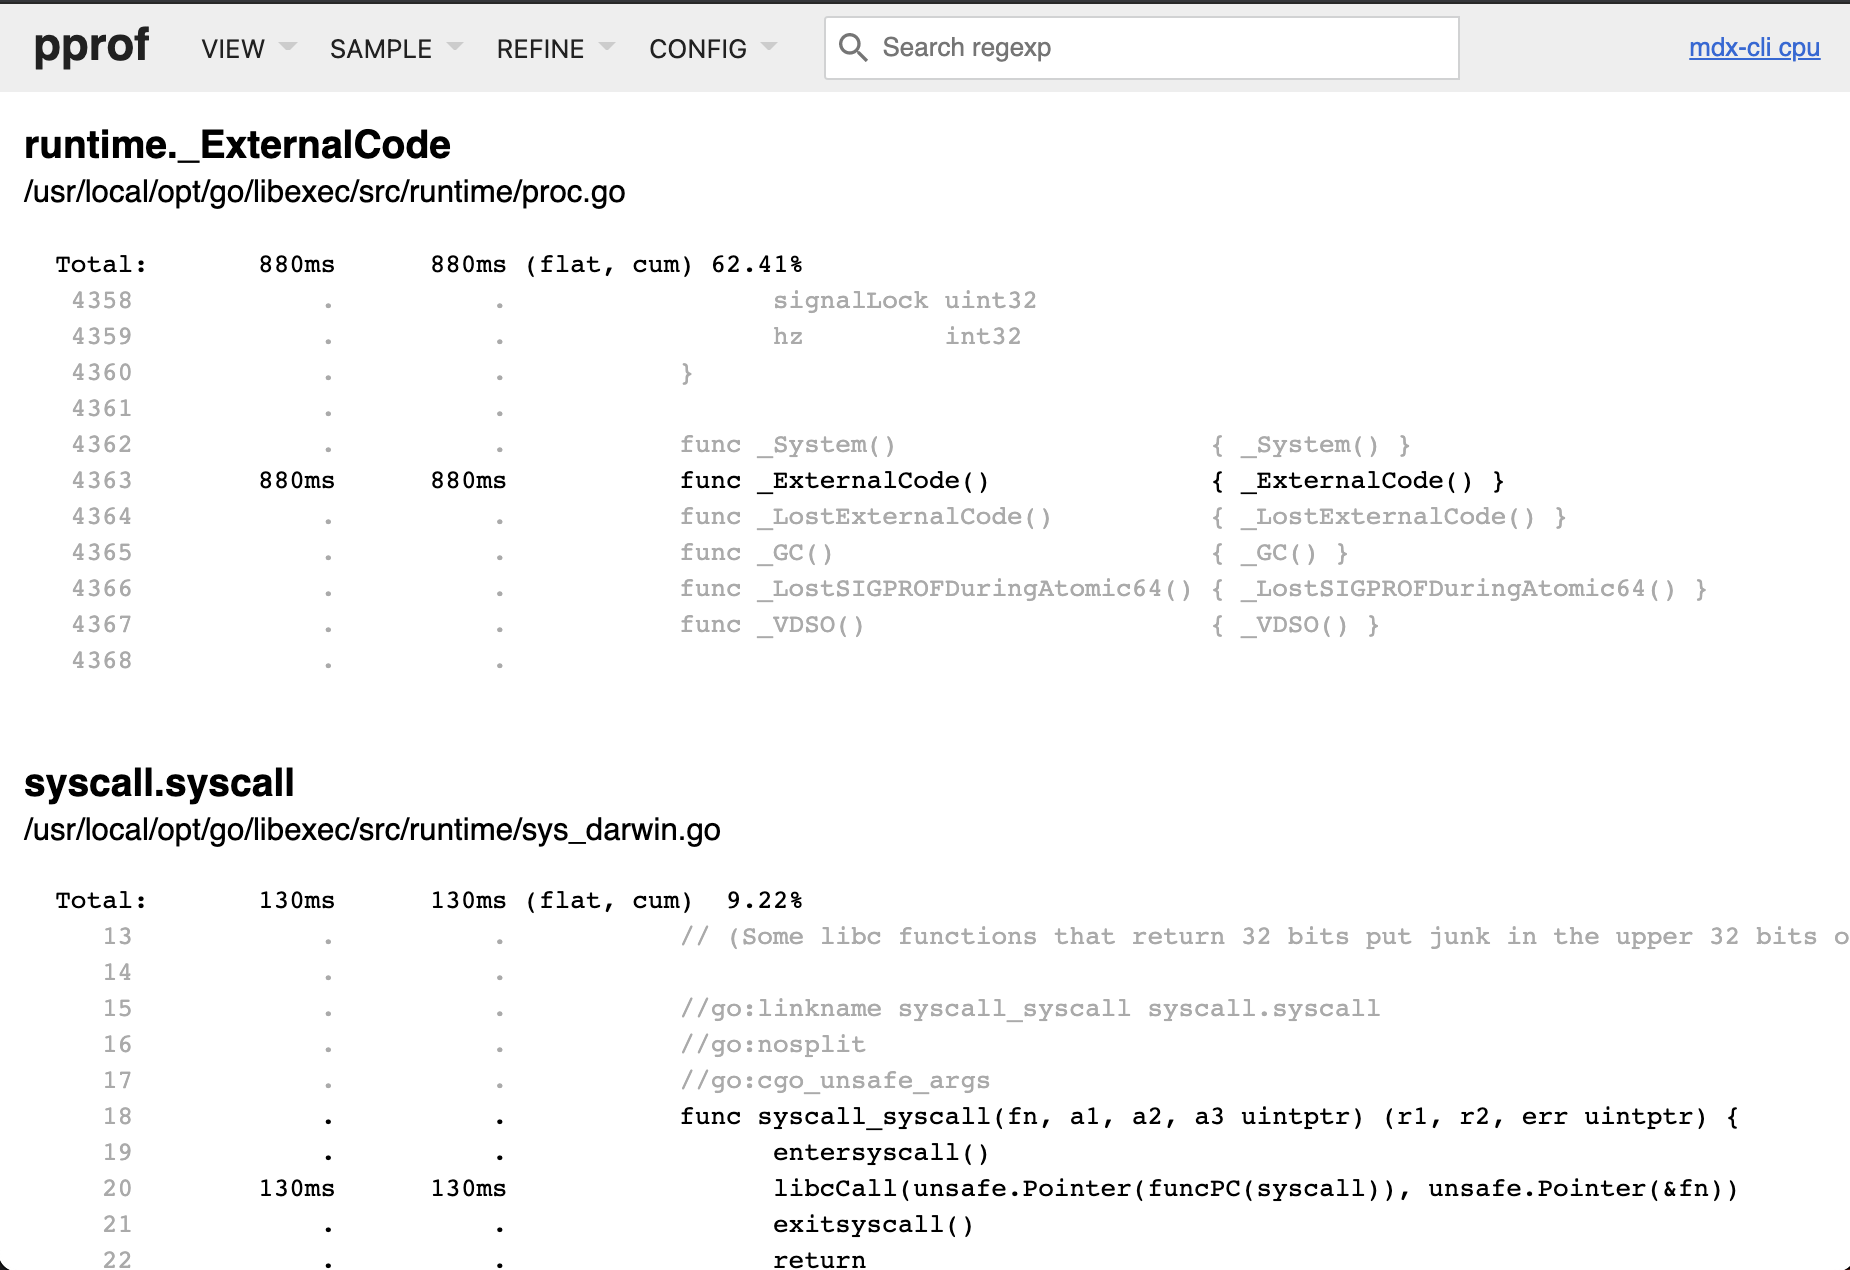
Source view 可以列出函数调用的源代码。为了让此视图正确显示,你需要使用 go tool pprof 版本,命令行的 pprof 版本有可能不能呈现源码。此外,在加载视图时必须添加你的 app 的可执行文件:
1

go tool pprof -http :6060 bin/mdx-cli ref/cpu.prof
Disassemble View
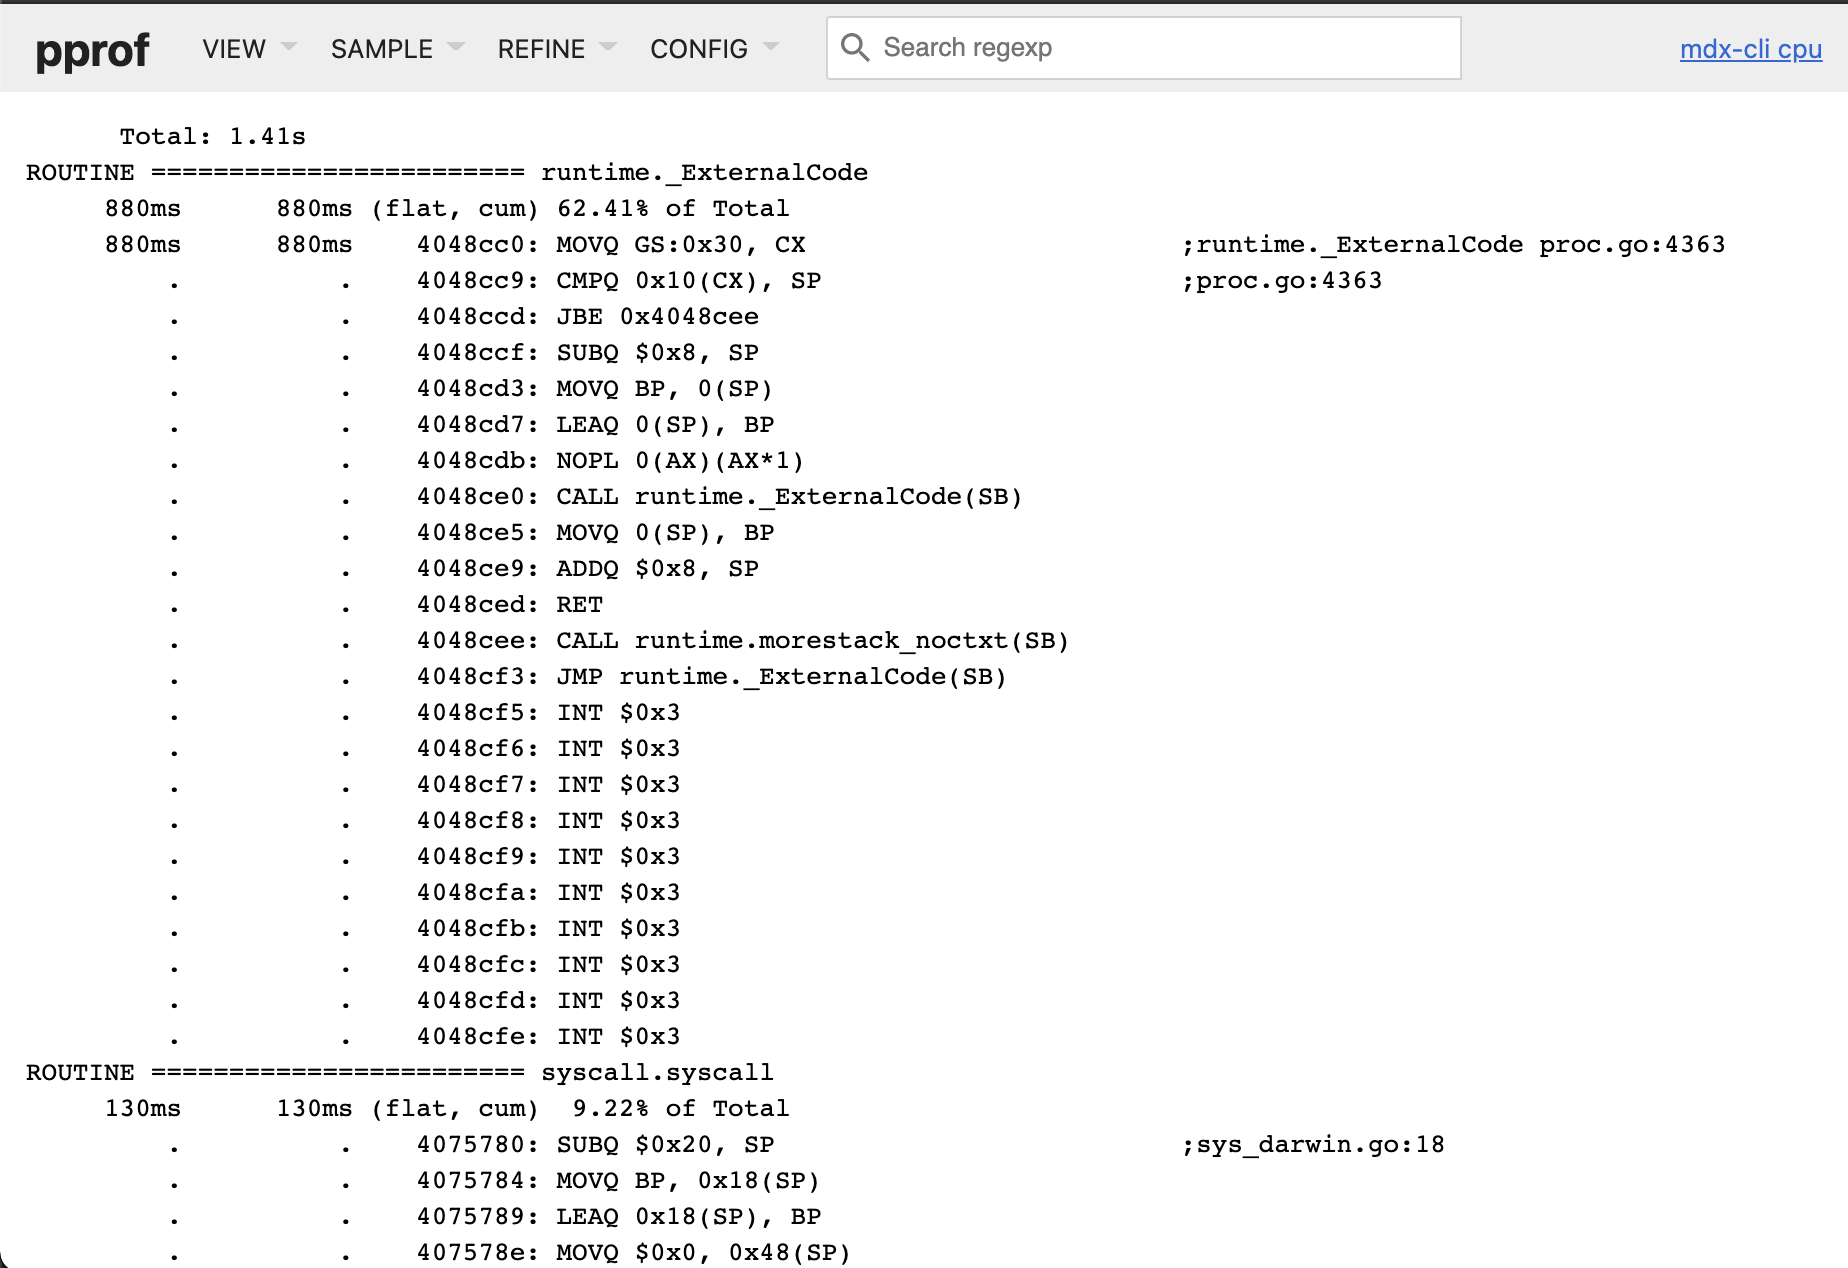
和 Source view 差不多,只不过显示的是汇编代码。
如何分析 pprof 性能数据
这是一个很难解说的话题。
一般来说,多数性能数据你可以望文生义。
如何筛选、如何聚焦可以借助 pprof 的 web 界面进行正则式筛选。
更详细的参考说明需要直接查看 Profiling Go Programs - The Go Blog 。
如何定位不良代码则需要长期的调试经验。
留下评论